
Quantifying Relative Importance of Coronary Risk Factors on Patient Survival Following Coronary Artery Bypass Grafting: A Maximum Likelihood Analysis
G.M. Lindsay1*, N.A. Tayyib1, H. Asfour1,2, R. Pushpamala1, E. Nomani1, F.J. Alsolami1
1College of Nursing Studies, Umm Al-Qura University, Makkah, Saudi Arabia
2Faculty of Nursing, University of Alexandria, Alexandria, Egypt
Abstract
Background: Coronary artery bypass grafting (CABG) is a major surgical intervention to relieve symptoms and promote survival for individuals with coronary heart disease (CHD). The benefits of the intervention are thought to be improved when underlying risk factors of CHD are ameliorated. However in current health care systems the long-term follow-up of patients following CABG is not centralized to allow for the determination of survival trends and their optimization. The survival of study participants who underwent CABG is compared with age and gender matched individuals from the general population. Differences in rates of survival are interpreted in terms of lifestyle choices and the impact of risk factors of CHD.
Method: Survival data were obtained from government records to 18 years post intervention on a cohort of patients underwent CABG and participated in a long-term follow-up program. Cardiac symptoms and risk factors of CHD were collected from consenting participants (44 women and 164 men) prior to CABG and at clinical assessments at one and eight-year follow-ups. Important clinical and lifestyle factors were identified and their impact on post-operative survival was quantified using a maximum likelihood technique. Male and female patients were investigated separately and a good fit between observed and simulated survival experiences was confirmed by Monte Carlo simulation.
Results: Cardiac symptoms were exhibited by 75.8% of women and 68.3% of men (χ2=0.712, p=0.3988) one-year post operation, and by 84.2% of women and 70.2% of men eight-years post operation (χ2=1.556, p=0.212). Male long-term survival at 54.3% after 18 years was significantly better than 36.4% for females (χ2=4.449, p=0.035), but both were worse than 73.0% and 71.5% (p=0.6114) respectively for gender and age-matched cohorts from the general population.
Important risk factors for women were post-operative smoking and post-operative hypertension reducing annual post-operative survival by 3.9% and 2.7% respectively and by 6.6% when both present. Equivalent important risk factors for men are post-operative smoking and unrelieved/recurring cardiac symptoms reducing annual survival rates by 2.4% and 1.2% respectively and by 3.6% when both present.
Conclusion: Eighteen year survival post CABG was significantly better for men than women, but both were worse than that for the general population. Post-operative smoking was the most significant risk factor associated with decreased rates of survival followed by unrelieved/recurring cardiac symptoms for men and persisting hypertension for women.
Introduction
Coronary Heart Disease (CHD) is the leading cause of death and disability in the industrialized world1. Much research and many treatments have been developed in an attempt to either prevent the disease, or in persons with CHD, to improve their survival and health quality of life through medical and surgical means. Coronary Artery Bypass Grafting (CABG) is one such treatment showing improved longevity for patients with continuing symptoms of CHD after optimal medical management2.
This work extends the temporal horizon of a cohort study which reported previously on earlier outcomes of patients who underwent CABG surgery3-7. Survival data for these patients are reported here to 1st January 2014 (≈18 years post surgery) and are used to determine what important risk factors have influenced the survival experience of this cohort4,6,7. Data in the public domain are typically 30 day mortality and numbers of hospital procedures and their rates of mortality8-12. The patients investigated in this work had 30 day mortality rates of 11.4% for women and 3.6% for men, both of which are significantly higher than current mortality rates for CABG3,9.
Although it is important to understand the various factors controlling the short-term survival of patients post CABG, in order to take advantage of improved short-term survival rates requires an appreciation of the relative importance of longer-term risk factors in promoting survival. The term “long-term” in the literature largely refers to survival beyond several years post surgery. Such studies typically divide into analyses of survival from 3 to 10 years post-surgery, and a few exploring survival beyond 10 years of which this investigation is a rare example. The latter often take their working data from a national database which has been systematically compiled from hospital records of CABG or synthesized from the findings of smaller studies. For example, Adelborg et al. recently reported on the 30-year mortality experience of individuals in the Danish population who underwent CABG between 1980 and 200913. The data comprised 51307 CABG patients and 513,070 persons from the general population. They reported that patients who underwent CABG experienced higher rates of mortality than the general population, particularly within 30 days of surgery (3.2% vs. 0.2%) and after 10 years post surgery (51.1% vs. 35.6% from 10 to 20 years and 62.4% vs. 25.0% from 20 to 30 years).
The novelties in this work lie, first, in the use of mortality tables for diseased populations, second, in the incorporation of time evolving post-operative risk within these tables, and finally in the use of a maximum likelihood methodology to compare the survival of patients to 18 years post CABG against that of gender and age-matched individuals from the general population over the same period. The maximum likelihood approach is similar to Cox regression or multivariate logistic regression commonly used in survival studies14-22. Mortality tables allow mortality in a diseased population due to ageing alone to be compensated by comparing it against that of gender and age-matched individuals in the general population. Important risk factors influencing long-term survival can then be identified and quantified in relatively small samples of diseased patients. The approach is general, could be integrated within a computer package, and requires for its operation survival data for the general and sample populations together with a list of risk factors to be considered.
Methods
The study protocol for the overall study, methods, ethical and clinical access permissions are published elsewhere4. Data used in this paper include new survival data and other data which are a subset of the larger dataset used in the original study cohort examining wider health outcomes and quality of life following CABG3-5. Data on survival/times of death were extracted through a data linkage with permissions from ISD Statistics Registrar General23.
Study participants
Briefly, the study cohort prior to surgery (baseline) comprised 44 female patients aged 40 to 79 years (mean=58.01±7.67) and 164 male patients aged 40 to 74 years (mean=58.84±7.57).
Baseline male and female age distributions are illustrated in Figure 1. A chi-squared test indicates that these distributions were not significantly different (χ2=1.395, p=0.989).
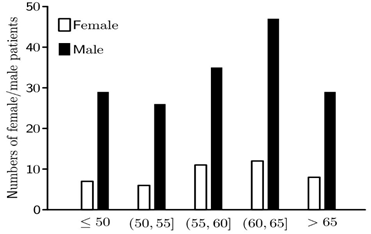
Figure 1: Figure illustrates the numbers of male (solid) and female (clear) patients in 5 year age bands at the time of surgery.
The Maximum Likelihood methodology
The maximum likelihood methodology in the context of this study is developed in four stages which are now described in overview in the text, but with a comprehensive description of the technical details underlying each stage in the Appendix. Maximum likelihood is an asymptotically unbiased and optimal estimation procedure in the sense that it achieves the Cramer-Rao lower bound as the sample size approaches infinity24. When feasible, maximum likelihood estimation is therefore the methodology of choice because it provides increasingly unbiased parameter estimates with the best achievable standard error as the size of the data set is progressively increased. The methodology is used widely, for example, in Finance, Biology and Economics25-27.
Stage I: Mortality tables for the diseased male and female populations are constructed and used to compare the rate of survival of individuals in the risk group with age matched individuals in the general population28. This strategy compensates for decreasing survival within the risk population by virtue of ageing alone, and also allows for the possibility that the important risk factors of CHD are gender dependent.
Stage II: Mortality tables developed at Stage I are used to calculate the probabilities of survival beyond or death within the period of the study for each participant. Participants behave independently, and therefore the likelihood function to be maximized for the male and female cohorts is the product of the contribution from each patient.
Stage III: In the parlance of insurance, extra risk resulting from lifestyle choices and the presence of risk factors of CHD is specified in terms of a ‘loading’ pertaining to each risk factor with higher loadings being associated with greater risks29. The possible reoccurrence of hypertensive and cardiac risks, the onset of diabetes mellitus together with the relief of cholesterol risk means that loadings in this study are intrinsically time dependent.
Stage IV: The likelihood function constructed at Stage II is maximized and the value of the loading pertaining to each risk factor is identified together with its associated standard deviation. Initially all risk factors are considered, but risks with loadings within two standard deviations of zero have p>0.050 and are judged to be not significant. Using this strategy, the maximum likelihood procedure is iterated and the current least important risk factor is eliminated. Iteration terminates when all remaining risk loadings are significant. However, the number of important risk that can be identified in this investigation is limited by the small sizes of the male and female cohorts.
Results
Results divide into descriptive properties of the male and female cohorts including comparisons of incidences of male and female risk factors, and the identification and estimation of loadings for the important risk factors.
Cohort survival
Eight male and six female patients died prior to a one-year follow-up. A further 25 male and 8 female patients died between the one-year and an eight-years follow-ups, and at the final time of data collection eighteen years post surgery a further 46 male and 14 female patients had died leaving 85 (51.8%) surviving males and 16 (36.4%) surviving females from the initial sample of 164 male and 44 female participants (χ2=4.449, p=0.035). Male long-term survival is therefore significantly better than that for females. Equivalent percentages for an age-matched cohort from the general population are 73.0% for males and 71.5% for females (p=0.6114)30. Figure 2 plots the percentage survival of the male and female diseased cohorts, and for comparison purpose, plots of the expected survival for the age matched male and female cohorts from the general population.
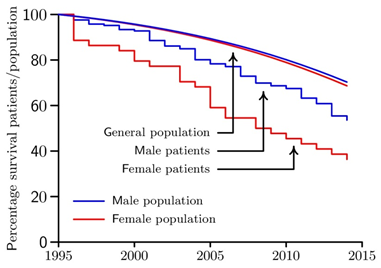
Figure 2: The Kaplan-Meier percentage survival plots for the male (blue) and female (red) cohorts of CABG patients are illustrated together plots of the percentage expected survival for age-matched male (blue) and female (red) cohorts from the general population.
Lifestyle, cardiac and CHD risks
Table 1 reports on the various lifestyle, cardiac and risk factors of CHD to be considered in this study. Disparities in numbers between baseline and the one-year follow-up are due to early deaths, incomplete data and participants withdrawing consent.
Table 1: Numbers of female and male patients are reported with/without hypertensive risk, obesity risk, pre- and post-operative smoking risks (PRE-SMK & PST-SMK), diabetes mellitus risk (DM), cardiac symptoms and cholesterol risk (CHOL). Bracketed numbers record the risk status of the same patients at two different times of data collection.
|
Time of assessment |
Risk condition |
Female (N) |
Male (N) |
||
|
Present |
Absent |
Present |
Absent |
||
|
Baseline 1 year 8 year |
Hypertensive risk: diastolic blood pressure ≥ 90 and/or systolic blood pressure ≥ 140 |
22 20 (8) 11 (10) |
21 11 (6) 7 (4) |
74 89 (60) 69 (61) |
88 48 (32) 37 (31) |
|
Baseline |
Obesity risk: body mass index ≥ 30 kg/m2 |
3 |
41 |
43 |
123 |
|
Baseline 1 year |
Pre-op smoker (PRE-SMK > 0) Post-op smoker (PST-SMK > 0) |
21 8 |
23 26 |
95 37 |
71 110 |
|
Baseline 8 year |
Diabetes mellitus present DM > 0 |
2 (1) 4 (4) |
42 (17) 14 (14) |
23 (13) 26 (26) |
143 (93) 80 (80) |
|
Baseline 1 year 8 year |
Cardiac risk: The presence of angina and/or breathlessness symptom(s) |
41 25 (12) 16 (13)
|
2 8 (4) 3 (3) |
159 99 (54) 66 (62) |
2 46 (34) 28 (26) |
|
Baseline 1 year 8 year |
Cholesterol risk: Cholesterol score ≥ 5.0 (CHOL ≥ 5.0) |
24 21 (9) 2 (2) |
10 11 (5) 16 (12) |
114 88 (61) 30 (28) |
38 48 (31) 75 (64) |
Raza et al. report diabetes mellitus rates for patients who have undergone CABG of ≈7% in the 1970s reaching ≈33% around 2000 and increasing to ≈40% around 200931. The male and female incidences of diabetes mellitus (DM) in this study are low at 13.9% and 4.5% respectively potentially limiting the identification of DM as a risk factor influencing patient survival.
Bracketed numbers in Table 1 record the absence/presence of each risk factor for all patients with complete data for that risk at two different times. These data are used to estimate how various risks of CHD evolve. For example, of 88 male patients providing cardiac data at the one and eight-year follow-ups, the number experiencing a cardiac symptom increased from 54 to 62. By contrast, male cholesterol risk was relieved in 33 patients over the same period. If a risk either recurs or is relieved at a constant annual rate of R/year, then the probability that that risk has not recurred or not been relieved after t years is e-Rt. The bracketed data of Table 1 allows the value of R to be estimated for each risk factor. This information will be used in the subsequent analysis to evolve time dependent risk factors.
Table 2: Estimated values are given for the annual reoccurrence rates of cardiac symptoms, hypertensive risk and the onset of diabetes and the annual recovery rate from cholesterol risk.
|
Risk factor |
Female rate of recurrence/recovery |
Male rate of recurrence/recovery |
|
Recurrence of cardiac risk |
e-7R=3/4 -> R=0.0411 |
e-7R=26/34 -> R=0.0383 |
|
Recurrence of hypertensive risk |
e-7R=4/6 -> R=0.0579 |
e-7R=31/32 -> R=0.0045 |
|
Onset of Diabetes Mellitus |
e-8R=14/17 -> R=0.0243 |
e-8R=80/93 -> R=0.0188 |
|
Relief of cholesterol risk |
e-7R=2/9 -> R=0.2149 |
e-7R=28/61 -> R=0.1112 |
A chi-squared comparison of the incidence of female hypertensive risk between baseline and the one-year follow-up gave χ2=1.309, p=0.253 (Table 1). The same comparison for male patients gave χ2=11.133, p=0.001. Female numbers may be insufficient to draw a statistically significant conclusion, but the male result indicates that a side effect of CABG is increased patient susceptibility to hypertensive risk. Many patients exhibit cholesterol risk (Table 1) at baseline, and almost all have cardiac symptoms. At the one-year follow-up cardiac symptoms were present in 75.8% of women and 68.3% of men (χ2=0.712, p=0.399) rising to 84.2% of women and 70.2% of men eight years post operation (χ2=1.556, p=0.212). Although the majority of patients were relieved of angina symptoms at the one-year follow-up, surgery was rather less effective in relieving breathlessness symptoms and reducing cholesterol risk.
Risk factor loadings
After the systematic elimination of risks judged not to be significant (Stage IV), the important risks for men were post-operative smoking and the presence of cardiac symptoms. For women the equivalent risks were post-operative smoking and the presence of hypertension. Table 3 shows the loadings of each important risk with its standard error.
Table 3: Estimated values of the loading (standard error) for the important risks for female (N=31) and male (N=142) CABG patients.
|
Female N=31 |
|
Male N=142 |
||
|
Risk |
Loading |
|
Risk |
Loading |
|
Post-op smoking |
0.0393±0.0323 |
|
Post-op smoking |
0.0244±0.0119 |
|
Hypertension |
0.0277±0.0125 |
|
Cardiac symptom |
0.0125±0.0050 |
By comparison with an age-matched male in the general population, the loadings in Table 3 translate into annual percentage reductions in male post CABG survival of 2.4% if a post-operative smoker, 1.2% if suffering from a cardiac symptom and 3.6% if a post-operative smoker also suffering from a cardiac symptom. The comparable reductions for female patients are 3.9% if a post-operative smoker, 2.7% if suffering from a cardiac symptom and 6.6% if a post-operative smoker suffering from hypertension. The penultimate risk factor to be eliminated in the case of male patients was the presence of diabetes mellitus and for female patients this factor was obesity, which had a negative loading. Although not statistically significant in this study, the negative value of this loading suggests that obese female patients may have a marginally better survival post surgery. In a large study conducted by Terada et al. obese females were observed to have significantly better survival post CABG21.
Goodness-of-fit of the important loadings in Table 3 was tested using Monte Carlo simulation involving 5000 repetitions of the survival of the male and female cohorts32. Figure 3 illustrates the level of agreement between the Kaplan-Meier survival plots (stepped) and the average mean survival curves (smooth) for the male and female cohorts. Dashed lines denote the simulated upper and lower bounds of the 95% confidence interval. Nowhere do the observed survival curves lie outside the 95% confidence bounds. The loadings in (Table 3) are therefore reliable indicators of the post-operative survival experience of the male and female cohorts.
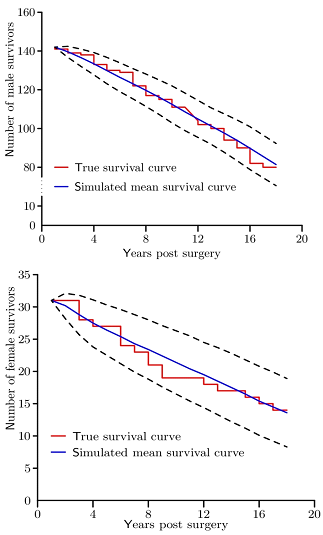
Figure 3: Kaplan-Meir survival plots (stepped) are plotted together with simulated mean survival curves (smooth) calculated from Monte Carlo simulation exercises involving 5000 trials of the male/female survivor models using the risk factors and loadings of Table 3. Dashed lines denote the simulated upper and lower bounds of the 95% confidence intervals
Discussion of Results
This study set out to identify important risk factors affecting the post-operative survival of patients who underwent CABG, and to quantify the annual loading associated with each risk. Post-operative smoking and the presence of a post-operative cardiac symptom were identified as the important risks influencing the post-operative survival of male patients accounting for annual reductions of 2.4% and 1.2% respectively (3.6% when both are present) by comparison with an age-matched male from the general population. For female patients the important risks are post-operative smoking and hypertension accounting for 3.9% and 2.7% respectively (6.6% when both are present) by comparison with an age-matched female from the general population. The long-term survival for the patients in this study closely follow patterns reported in actual patient surveys involving the recall of patients in order to obtain follow-up data33,34. The strategy used relies on survival data for the general population and the study population together with estimated rates of the recurrence/relief of risk factors of CHD30. The maximum likelihood approach offers a way to manage missing data using population survival data and minimal patient follow-up.
A novel development in this work uses a mortality table for the general population to manage the effects of ageing in a diseased population and incorporate extra risks30. These risks for patients post CABG are expressed as time-dependent loadings, one for each risk factor present. The strategy, however, can be applied to any situations in which survival is degraded by excessive exposure to risks not representative of the general population. The output of the maximum likelihood approach is then optimal values of risk factor loadings and their significance.
The novel idea of evolving risk in this work, e.g. recurrence of cardiac symptoms or relief of cholesterol risk, has general applicability and allows risk to be managed long-term with minimal recall of patients. In this study the rates of recurrence/relief of risks are estimated from data collected at the one and eight-year follow-ups. In this same cohort of patients earlier follow-up showed that well-being (SF36 scores) had also declined despite overall improvements in the initial years after operation35. This trend has been reported in other larger researches. In another study of 30 years follow-up after CABG the majority of patients (94%) had a repeat revascularisation intervention, similarly showing the lack of endurance of the relief of cardiac symptom after maximal pharmacological treatment33. However, atherosclerosis is known to occur, particularly when risk factors of CHD remain above target levels. As can be noted from Table 1, the attainment of optimal levels of risk factors remains suboptimal and could provide some explanation for the recurrence of cardiac ischaemic symptoms. Unfortunately, these are not uncommon findings; adverse lifestyle trends have also been reported in large surveys of lifestyle and risk factor targets of patients with coronary or other athersosclerotic disease and people at high risk of developing cardiovascular disease36.
The importance and novelty of the maximum likelihood approach lies in its optimality: it is the method of choice whenever feasible. Specifically, the maximum likelihood technique generates asymptotically unbiased estimates of risk factor loadings and achieves the Cramer-Rao lower bound as the volume of data is increased24. Maximum likelihood estimation has widespread uses inter alia in Finance, Biology and Economics25-27. For example, Avdis and Watcher use this strategy to estimate the extra interest over and above the risk-free rate that is earned for holding a risky asset25. Such premia inform investors how best to divide portfolios between risky (equities) and non-risky (bonds) assets. Lanot’s use of the maximum likelihood approach in the labor market mirrors the survival modeling of this article27. An individual choosing to participate or not participate in the labor market is analogous to a patient dying within the study period or surviving beyond the end of the study.
Diabetes mellitus was not identified as a strong risk factor of CHD for male or female long-term survival in this study despite its known adverse impact on life-span18. An investigation of the long-term survival of 2766 patients who had undergone CABG, 43.4% of who had type II diabetes, concluded that the impact of diabetes on survival was measureable only after 10 years22. The finding here is therefore unsurprising given the sizes and incidences of diabetes in the study cohorts.
The importance and utility of cardiac patients’ estimates of symptom severity assessments remains under investigated, yet it is of paramount importance to patient and family well-being and quality of life, and acts as a catalyst for healthcare utilization37. This work sheds light on the patients’ health benefits in the longer time after an intensive intervention, and highlights that continued cardiac symptoms are associated with reduced survival in males. Even as electronic records system become embedded in healthcare administration, further development would be required in order to capture these important long-term patient experiences to help support choices in clinical decision-making from both patient and clinician perspectives. As digital devices become more acceptable and reliable in health monitoring and feedback, such devices could provide a sense of empowerment and motivation for individuals to try and optimize their cardiovascular health. Through improved engagement of patients with their health care professionals and through appropriate health activities, improved health outcomes could be achieved, although expert bodies recommend that more research is required to identify the best way to harness the capabilities of these devices38.
Conclusions
Male survival 18 years following CABG was significantly better than female survival, but both were worse than age-matched individuals from the general population. New insights on the relative importance of risk factors of CHD in post-operative survival were assessed using a novel application of maximum likelihood estimation. Continued smoking was the most significant risk factor associated with decreased survival in the total group. Thereafter recurrence of cardiac symptoms in males and persistent hypertension in females were the most important other factors degrading survival.
Limitations
The most important limitation in this study is the small sizes of the male and female cohorts. Consequently only the most important risk factors could be identified. This limitation was particularly relevant for diabetes risk due to the small fraction of participants with this disease.
Acknowledgements
The initial phase of this study was undertaken as a research training fellowship funded by the Chief Scientist Office, Scottish Office, Department of Health, Scotland. A cohort follow-up study was funded by the Chief Scientist Office, Scottish Office, Department of Health, Scotland, reference number 31560, CZH/4/44.
Conflict of interest
The authors confirm no conflict of interests in any aspect of this study or the preparation and writing of this manuscript.
Ethical statement
Ethical approval was granted by the Local Ethics Research Committee, Glasgow Royal Infirmary in 1996 at the outset of this long term cohort study. Re-applications for ethics review at 7, 12 and 15 years were approved.
References
- BHF Living with heart disease. https://www.heartfoundation.org.au/your-heart/living-with-heart-disease Accessed 29th September 2019.
- Taggart DP. CABG or stents in coronary artery disease: end of the debate? The Lancet. 2013; 381: 9867, pp. 605–607.
- Lindsay GM. The health and well-being of individuals before and after coronary artery bypass surgery. PhD Thesis University of Glasgow Library. 1998.
- Lindsay GM, Smith LN, Hanlon P, et al. Coronary heart disease patients' perception of their health and expectations of benefit following coronary artery bypass grafting. J Advanced Nursing. 2000; 32: 1412-1421.
- Lindsay GM, Hanlon P, Smith LN, et al. Assessment of changes in general health status using the short-form 36 questionnaire 1 year following coronary artery bypass grafting. Eur. J. Cardio-thorac Surg. 2001; 18: 557-564.
- Lindsay GM, Tolmie EP, Martin WM, et al. Smoking after Coronary artery Bypass; high early follow up mortality. Thoracic and Cardiovascular Surgeon. 2009; 57: 135-140.
- Belcher PR, Gaw A, Cooper M, et al. Are we negating the benefits of coronary artery bypass grafting? Journal of Human Hypertension. 2002; 16: 691-697.
- Bridgewater B. Cardiac registers: the adult cardiac surgery register. Heart. 2010; 96: 1441-1443.
- National Audit, Cardiac Surgery Audit report data 2010/11. https://data.gov.uk/dataset/813153dc-66b9-4049-a968-a603cd7f2ef2/national-adult-cardiac-surgery-audit-report-data-2010-11/datafile/1a6cebb7-9415-4bef-bc6c-469cd54b9224/preview Accessed 16th Jan, 2019.
- Chung PJ, Carter TI, Burack JH, et al. Predicting the risk of death following coronary artery bypass graft made simple: a retrospective study using the American College of Surgeons National Surgical Quality Improvement Program database. J Cardiothorac Surg. 2015; 10: 62. Published 2015 Apr 29. doi:10.1186/s13019-015-0269-y
- Hansen LS, Hjortdal VE, Andreasen JJ, et al. 30-day mortality after coronary artery bypass grafting and valve surgery has greatly improved over the last decade, but the 1-year mortality remains constant. Ann Card Anaesth. 2015; 182: 138-142, doi: 10.4103/0971-9784.154462
- CMS Measures Inventory tool. Hospital 30-day, all-cause, risk-standardized mortality rate (RSMR) following Coronary Artery Bypass Graft. https://cmit.cms.gov/CMIT_public/ViewMeasure?MeasureId=2264 Accessed 4th Oct. 2019.
- Adelborg K, Horváth-Puhó E, Schmidt M, et al. Thirty-Year Mortality After Coronary Artery Bypass Graft Surgery: A Danish Nationwide Population-Based Cohort Study. Circ Cardiovasc Qual Outcomes. 2017; 10: e002708. DOI: 10.1161/CIRCOUTCOMES.116.002708.
- Cox DR. Regression models and life tables (with discussion. Journal of the Royal Statistical Society. Series B Statistical Methodology. 1972; 34: 184–220.
- McDonald JH. Handbook of Biological Statistics. Sparky House Publishing. 2015.
- Karim MN, Reid CM, Huq M, et al. Predicting long-term survival after coronary artery bypass graft surgery. Interact CardioVasc Thorac Surg. 2018; 26: 257–63.
- Wang J, Yu W, Zhao D, et al. In-Hospital and Long-Term Mortality in 35,173 Chinese Patients Undergoing Coronary Artery Bypass Grafting in Beijing: Impact of Sex, Age, Myocardial Infarction, and Cardiopulmonary Bypass. Journal of Cardiothoracic and Vascular Anesthesia. 2017; 31: 26–31.
- Shahian DM, O'Brien SM, Sheng S, et al. Predictors of Long-Term Survival After Coronary Artery Bypass Grafting Surgery. Circulation. 2012; 125: 1491-1500. https://doi.org/10.1161/CIRCULATIONAHA.111.066902
- Wu C, Camacho FT, Wechsler AS, et al. Risk score for predicting long-term mortality after coronary artery bypass graft surgery. Circulation. 2012; 22125(20): b2423-30. doi: 10.1161/CIRCULATIONAHA.111.055939.
- Kilpin M, Talwar A, Meneguzzi J, et al. Two Long-Term Mortality Risk Models For Coronary Artery Bypass Graft Surgery Produced in American Populations Validated in an Australian Population. Heart and Lung Circulation. 2018; 271: 79–88. DOI: https://doi.org/10.1016/j.hlc.2017.02.008
- Terada T, Forhan M, Norris CM, et al. Differences in Shortâ and LongâTerm Mortality Associated With BMI Following Coronary Revascularization. J Am Heart Assoc. 2017; 6(4): e005335. doi: 10.1161/JAHA.116.005335
- Kogan A, Ram E, Levin S, et al. Impact of type 2 diabetes mellitus on short- and long-term mortality after coronary artery bypass surgery. Cardiovascular Diabetology. 2018; 17: article 151.
- National Data Catalogue, ISD Scotland. https://www.ndc.scot.nhs.uk/National-Datasets Accessed 20th March, 2020.
- Martin VL, Hurn AS, Harris D. Econometric Time Series Modelling. CUP: New York. 2013; 63-64.
- Avdis E, Wachter J. Maximum likelihood estimation of the equity premium. Journal of Financial Economics. doi 10.1016/j.jfineco.2017.06.003.
- Bertl J, Ewing G, Kosiol C, et al. Approximate maximum likelihood estimation for population genetic inference. Stat Appl Genet Mol Biol. 2017; 16(5–6): 291–312. https://doi.org/10.1515/sagmb-2017-0016
- Lanot G. Maximum likelihood and economic modeling. IZA World of Labor | January 2017 | wol.iza.or
- Definition of a mortality table https://www.investopedia.com/terms/m/mortality-table.asp Accessed 4th April 2020.
- Definition of loading in the context of risk. https://economictimes.indiatimes.com/wealth/personal-finance-news/what-is-loading-in-insurance-how-does-it-affect-your-premium/articleshow/26470877.cms Accessed 4th April 2020.
- Office for National Statistics, 2018. National life tables for Scotland. https://www.ons.gov.uk/peoplepopulationandcommunity/birthsdeathsandmarriages/lifeexpectancies/datasets/nationallifetablesscotlandreferencetables
- Sajjad Raza, S, Blackstone EH, Sabik JF. (2015). The diabetes epidemic and its effect on cardiac surgery practice. The Journal of Thoracic and Cardiovascular Surgery. 2018; 150(4): 783-84.
- What is Monte Carlo simulation? https://economictimes.indiatimes.com/definition/monte-carlo-simulation Accessed 2nd April, 2020.
- van Domburg RT, Kappetein AP, Boger AJJC. The clinical outcome after coronary bypass surgery: a 30-year follow-up study. European Heart Journal. 2009; 30: 453–458.
- Thoracic Society for Cardiothoracic Surgery. https://scts.org/outcomes/thoracic Accessed 20th March, 2020.
- Lindsay GM, Ponaiah PR, Nomani I, et al. Long Term Health Outcomes Following Coronary Artery Bypass Grafting: A Different Journey for Men and Women. J Cardiol and Cardiovasc Sciences. 2019; 3(4): 1-9.
- Kotseva K. on behalf of the Euroaspire Investigators. The EUROASPIRE surveys: lessons learned in cardiovascular disease prevention. Cardiovascular Diagnosis and Therapy. 2017; 7(6): 633-39.
- Rumsfeld JS, Alexander KP, Goff DC, et al. American Heart Association Council on Quality of Care and Outcomes Research, Council on Cardiovascular and Stroke Nursing, Council on Epidemiology and Prevention, Council on Peripheral Vascular Disease, Stroke Council. Cardiovascular health: the importance of measuring patient-reported health status: a scientific statement from the American Heart Association. Circulation. 2013; 127: 2233–2249.
- Cardiosmart. American College of Cardiology https://www.cardiosmart.org/wearables
- Mons U, Müezzinler A, Gellert C, et al. Impact of smoking and smoking cessation on cardiovascular events and mortality among older adults: meta-analysis of individual participant data from prospective cohort studies of the CHANCES consortium. BMJ. 2015; 350. doi.org/10.1136/bmj.h1551.
Appendix
Stage I – The Mortality Table
Consider a model population in which lx individuals attain the age of x. The rate of mortality at age x, denoted by μx, is derived from lx by the formula

Gender based tables of lx used in this work were obtained from the Office for National Statistics [30] for the general population. Additional risk due to a history of CHD is incorporated within (1) by the specification

where μx(extra) quantifies the extra risks experienced by a patient at age x. The outcome is a new risk-adjusted table with lx* individuals alive at age x. Within this table, the fraction of individuals aged x years reaching age x+t years is

The central concept of this work is the construction and fitting of a model for μs(extra) to survival data for the male and female patients in this study. The fitting procedure is based on the principal of maximum likelihood estimation, which in overview is similar to logistic regression, but differs from it via the construction of the underlying model.
Stage II - Construction of the Likelihood Function
Consider the survival experience of n patients aged x1,...,xn at the time of operation when observed over a post-operative period of T years. The probability that a patient aged x at the time of surgery will die aged (x+t,x+t+Δx) years post-surgery, where t

Because each patient provides independent data, the probability of observing the survival experience of either cohort is the product of the probabilities contributed by each patient of that cohort, namely expression (4) for patients dying within T years of surgery, or expression (5) for surviving patients. For numerically reasons, however, it is preferable to minimize the sums of the negative logarithms of expressions (4) and (5), one contribution from each patient of the cohort.
Stage III - Specification of Extra Risk
The completion of the problem requires the specification of μs(extra) which must take into account the behavior of individual risk factors. Mons et al.39 suggest that the impact of pre-operative smoking ranges from 4.25 to 6.75 years for current smokers and between 1.4 and 2.4 years for former smokers. This information is incorporated within the specification of μs(extra) by tapering pre-operative smoking risk to zero over five years post-surgery. Subsequent analysis will assume a fixed hazard rate for each risk factor independent of age. What matters is the duration of a patient’s exposure to that risk. For a fixed annual hazard rate of h over t years post surgery, the impact of that risk on survival is managed by the expression

where R is the annual rate of reoccurrence. Following a similar logic, the impact of a relievable risk is modeled over t years post-surgery by the expression

The form of the time integral of μs(extra) post-surgery is the sum of expressions of type (8) or (9) taken over all risk factors as encapsulated in the general expression

where s denotes elapsed time post-surgery and the values of HPRE-SMK to HDM measure the loadings of the associated risks and will be estimated from patient data by maximum likelihood estimation. The function Φ(s) has value one if the subscripted risk is active at time s post-surgery and zero otherwise. For example, suppose that a patient has no hypertensive risk immediately post-surgery, then ΦBP(s)=0. The onset of hypertensive risk during the interval (s,s+Δs) post-surgery occurs with probability e-s RBP RBP Δs, so that ΦBP(u)=1 for u>s with this probability. Thus, for patients who do not initially have hypertensive risk

Stage IV - Estimation Procedure
The estimation strategy is an iterative procedure which begins by including loadings HPRE-SMK to HDM associated with all risk factors. On completion of the first iteration, each loading HPRE-SMK to HDM is assigned a value together with its standard deviation. Ordinarily loadings with values within two standard deviations of zero are discarded as not significantly different from zero. This strategy is repeated in which successive iterations are used to systematically eliminate loadings that are not significant until only primary risk factors remain, namely risk factors associated with loadings with value distant two standard deviations or more from zero. Risks factors associated with loadings close to two standard deviations from zero denote secondary risks. However, the sizes of the cohorts available to this investigation are small, particularly the female cohort, with the result that less important primary risk factors can be manifest as secondary risks.