
What are Adults’ Illness Representations, Mood and Quality of Life after Myocardial Infarction?
Elizabeth Tolmie, Grace M Lindsay*, Philip Belcher
College of Nursing, Umm Al-Qura University Makkah, Kingdom of Saudi Arabia
Abstract
Background: Survival after myocardial infarction (MI) is improving leading to increasing numbers of people dealing with heart health recovery, readjustment and re-investment in their future wellbeing and that of their family. Cardiac Rehabilitation (CR) aims to improve outcome by ensuring patients adopt recommended health maintenance strategies. This study explored the health maintenance needs of adults one to three years after an MI. The theoretical framework guiding the study was Leventhal’s Self Regulation Model. Data from the completion of different measures of health and illness representation are presented and the potential for measuring current health status and their explanatory factors is illuminated.
Aims: To identify the longer-term health needs of adults who have suffered an acute MI.
Methods: A mixed method design was used to explore respondents’ illness representations and the factors believed to be impacting on their longer-term health and health behaviour. A sample of 73 adults completed 3 questionnaires to assess their illness perceptions, mood and quality of life (QoL) 1 to 3 years after discharge from hospital. A sub-sample (n=30) participated in an interview, underwent a brief clinical assessment, and completed a small task. Data analysis used StatsDirect and Nudist 5.
Results: One to three years post-discharge, Personal and Treatment control belief scores of 22.6 ± 4.3 and 17.6 ± 4.3 respectively were strong, but perceived consequences high (20.6 ± 4.9). Many respondents were experiencing low energy (92%), breathlessness (67%) and chest pain (53%), and many reported a sense of loss that affected their ability to sustain health and positive health behaviour. Those with the poorest attendance at CR had poorer QoL, anxiety, and depression scores, and women had poorer outcomes than men in many of the indices assessed (p<0.05). Initial compliance with prescribed drug regimens and lifestyle recommendations (self-report) was not maintained.
Conclusion: This preliminary study supports the notion that there is a largely unmet and persistent health need among adults diagnosed with MI, and that more consideration needs to be paid to its longer-term effects and the needs of women. Combining surveys with interview methods and tools such as the PRISM+ provide an opportunity to understand the complexity of patients’ health evaluation.
Introduction
Cardiovascular disease (CVD) is responsible for almost 18 million deaths worldwide annually (2016 data). Of these, 85% are due to coronary heart disease (CHD) and stroke1. Despite a decline in associated mortality over the past 10 years, CHD remains a leading cause of death1,2. In Scotland, overall CHD mortality in the under 75s is highest in the most deprived compared to the least deprived areas (1112/100,000 vs 620/100,000 respectively), but overall has fallen markedly3. Improvements in survival4-6 mean that more people are now dealing with heart health recovery, readjustment, and re-investment in their health and wellbeing. Secondary prevention programmes such as Cardiac Rehabilitation (CR) aim to improve outcome by ensuring patients are prescribed appropriate drug regimens and encouraged to adopt healthy lifestyles. Yet positive lifestyle behaviours adopted after a cardiac event are often not sustained7. Anxiety, depression, social deprivation, quality of life (QoL)8-10 and illness perceptions can influence compliance with recommended risk reduction strategies11.
According to Leventhal’s Self-Regulation Model (SRM) (Fig 1), a person’s illness representations will guide the coping strategies (actions) used to achieve a desired health state or avoid an undesired one11. Thus, if the perceived health threat is combined with an appropriate action plan, long-term therapeutic change is possible12,13.
Study Aims
This preliminary study aimed to identify participants’ perceptions of their longer-term health needs and determine whether or not the variables investigated differed in respect of level of attendance at a CR programme.
Methods
Ethical approval was obtained from the Central Office for Research Ethics Committees, Glasgow.
The study was conducted in two stages. The first was a cross sectional survey mailed to 183 adults discharged from hospital after a diagnosis of MI one to three years earlier. In the second stage, a sub-sample of survey respondents (n=30) were interviewed, underwent a brief clinical assessment, and completed a simple task (Pictorial Representation of Illness and self-measure, PRISM+, Buchi et al.)14 (Figure 2). We used Leventhal et al.’s SRM (1980) as the framework for the study11.
This was operationalised using a cross sectional survey, a brief clinical assessment, a small task, and interviews.
The Self Regulation Model (SRM)
The SRM (Figure 1) incorporates six main domains within the cognitive component, namely Illness Representations, ‘illness identity’, ‘control’ (personal and treatment), ‘timeline’ (acute/chronic and cyclical), ‘consequences’, ‘cause’ and ‘coherence’. Active coping strategies (Actions) are generated through appraisal of cognitive and emotional responses (Emotional Representations) to the health threat (Feedback), with the adopted strategy being assessed (Appraisal) in relation to the goals set. This feedback mechanism represents the bi-directional aspect of the model whereby beliefs and behaviour may be modified if the strategies being employed are deemed ineffective11.
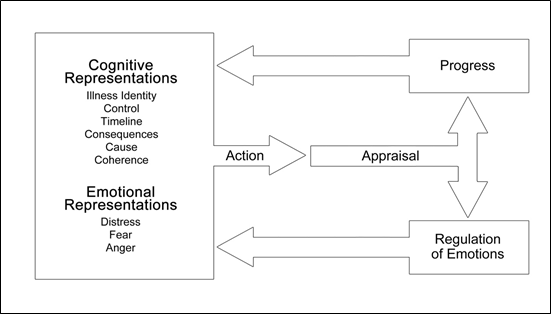
Figure 1: Adaptation of Leventhal’s self-regulation model illustrating the model’s feedback mechanism and relationship between cognitive and emotional representations
Findings from a study with older adults who had suffered a myocardial infarction (MI) support this concept15. The SRM has been used to explore relationships between illness cognitions and self-efficacy in cardiac patients16,17, adherence to lipid lowering drugs18, attendance at cardiac rehabilitation19 and symptomatic and asymptomatic atrial fibrillation20 as well as many non-cardiac conditions21-25.
Cross-sectional Survey: Multiple assessments
The cross-sectional survey comprised The Revised Illness Perceptions Questionnaire (IPQ-R)26, the Hospital Anxiety and Depression Scale (HADS)27 and the MacNew Health Related Quality of Life Questionnaire (MacNew)28.
The Illness Perceptions Questionnaire (IPQ-R)
The IPQ-R has two main components: Illness Representations and Emotional Representations. The first incorporates six domains from Leventhal’s SRM, (‘illness identity’, ‘control’ ‘timeline’ ‘consequences’, ‘cause’, ‘coherence’). The second comprises three (distress, fear, anger).
‘Illness identity’, is represented as a pre-determined list of symptoms that can be supplemented with illness-specific items29. Respondents indicate the symptoms experienced since diagnosis, then identify those they attribute to their illness. Each symptom is scored as 1 and the total summed. Higher scores indicate a stronger illness identity.
The ‘Cause’ component comprises a list of 18 items. Respondents indicate on a Likert scale (‘Strongly agree’ to ‘Strongly disagree’) the extent to which each has contributed to their illness. Only ‘agree’ and ‘strongly agree’ are scored, with each allocated a score of 1. Three items are selected as the most likely contributors and ranked accordingly (1, most likely; 3, least likely). Causal factors are combined and categorised before analysis.
All other dimensions of the IPQ-R are scored on a five-point Likert type scale (‘Strongly agree’ to ‘Strongly disagree’) with higher scores representing stronger beliefs in the associated area.
Hospital Anxiety and Depression Scale (HAD)
The Hospital Anxiety and Depression (HAD) Scale was developed for use in non-psychiatric settings to identify people with mood disorder who might require intervention. One component measures anxiety, the other depression. Each contains 7 statements rated on a four-point scale (0-3). Three cut-off points (8 to 10 = mild, 11 to 14 = moderate, 15 to 21 = severe) differentiate between different levels of anxiety and depression27.
The MacNew Quality of Life Questionnaire
The MacNew heart disease health-related quality of life questionnaire is a disease-specific measure designed to evaluate the impact of CHD and its treatment. It comprises 27 statements across three domains: physical, emotional and social functioning. A global score can be calculated. Each statement is scored on a seven point Likert scale. Scores are summed and the average calculated. Lower scores indicate poorer health-related quality of life28.
Stage Two: PRISM+ and Interviews
The PRISM task (Figure 2) is a generic quantitative and graphical measure of the perceived burden of illness that does not rely on users’ verbal or linguistic ability. The non-digital version comprises a white A4 board or sheet (landscape orientation) with a fixed yellow disc, 7cm in diameter, at the bottom right hand corner.
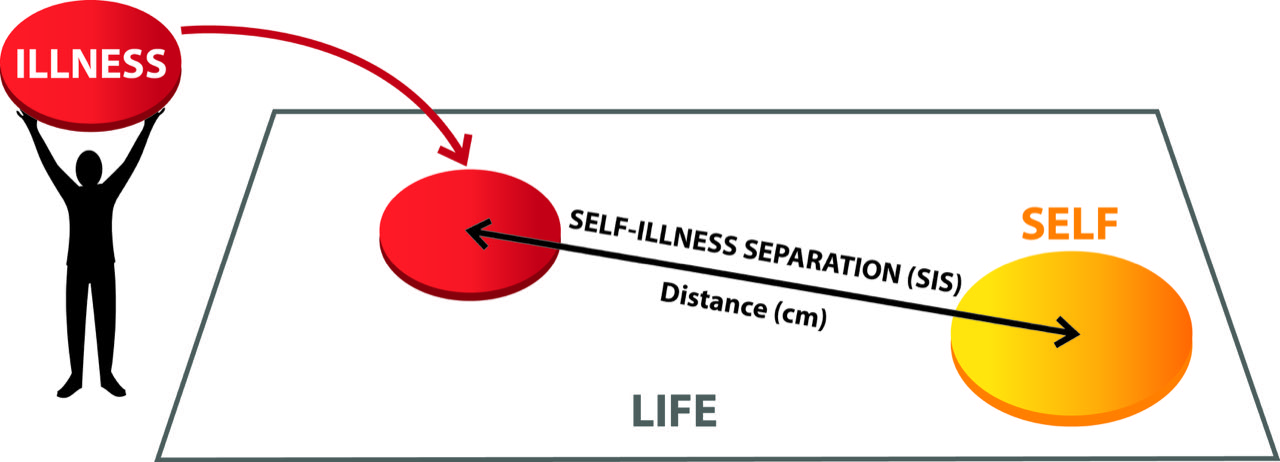
Figure 2: Representation of the PRISM+ instrument demonstrating the perceived impact of the life event (AMI) on the user’s life*
*White A4 board = PRISM user’s life at time of interview; yellow disc = the user (‘self’) in their life at that time; red disc = ‘life event’ being investigated (AMI) and user’s perception of its impact on their life; self-illness separation = impact of the ‘life event’ as measured by distance (cm) from ‘self’ (greater distance indicating less impact). N.B. Additional discs used to represent other factors impacting on the user’s life at that time.
Participants are asked to imagine that the board represents their life at that point in time, and the yellow disc represents self at that point in time. They are then given a 5cm red disc (representing their illness) and asked to place it on the board, in a position that best reflects where their illness is in their life at present30. The distance between the mid-points of the yellow disc and the placed disc represents self-illness separation. Shorter distance indicates greater perceived burden of illness. Additional discs (PRISM+) can be used to represent other aspects of their life31. When the task is complete, participants can be asked to discuss their placements of the discs.
In this study, audio-recorded one to one and group interviews were conducted with a sample (n=30) of the survey respondents. The PRISM+ was then used to measure SISD and explore users’ perceptions of their heart disease within the context of other factors believed to be impacting on their health and health behaviour.
Clinical Health Assessment
To determine current CHD risk factor status and provide an indication of the extent to which recommended risk reduction factors had been achieved, systolic and diastolic blood pressure (SBP and DBP), abdominal adiposity (waist circumference), BMI, and plasma cholesterol were measured. Prescription refill and self-report data were gathered to indicate current co-morbidities, cigarette smoking, alcohol consumption, compliance with prescribed drug regimens and recommended lifestyle behaviour.
Data Analyses
Survey data were analysed using StatsDirect software32. Attendance at CR was defined as < 25% (poor), 25% to 75%, (moderate) and >75% (good). The Mean and standard deviation (SD) were calculated for continuous data with a normal distribution. Median and interquartile range were calculated for ordinal data or where the distribution was skewed. A Kruskal-Wallis (KW) test was computed when comparing data across more than two groups, generating a Dwass-Steel-Critchlow-Fligner test when the result indicated a statistically significant difference33-35. Normally distributed continuous data from two groups were compared using an independent samples Student’s t-test. When these criteria were not met, the Mann Whitney U test was computed36. A chi-squared test was computed where data were nominal, with a Fisher-Freeman-Halton exact test computed where appropriate, with level of significance set at p<0.05. Qualitative analysis was ongoing throughout the study and in accordance with Framework37. All qualitative data were fully transcribed, checked for errors and imported into NUDIST 5® (QSR International)38. A Framework approach was applied when combining data sets37.
Results
From the cross sectional sample (n=360) of CR discharge records screened (representing approximately 10% of the target population), 230 (64%) met the study criteria (18-64 years, confirmed diagnosis of first MI one to three years earlier with or without subsequent PCI but no CABG surgery). Of the 183 invited to participate, 73 (40%) did so. Thirty were also interviewed (Figures 3 and 4).
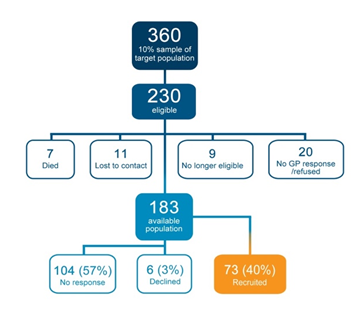
Figure 3: Flow chart of study recruitment to the survey (stage one)
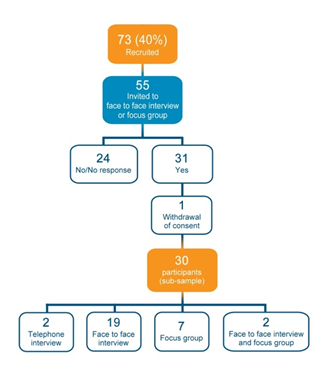
Figure 4: Flow chart of recruitment to stage two (interview) from the survey group.
Characteristics of the survey participants
Study participants comprised adults aged 20 to 63 years at the time of their MI (Mean 52.4, SD 8.3); a higher proportion of men (n=52) (independent proportion test p = 0.017) and fewer smokers (χ2 = 3.8, p = 0.001) took part. Otherwise, participants were similar to non-participants with regard to risk factor status at discharge. From the discharge data available, 14% (7 of 50) of participants were drinking in excess of the recommended weekly alcohol units. Over 65% (33 of 49) had elevated plasma cholesterol, 36% (8 of 22) elevated SBP and 18% (4 of 22), elevated DBP; 36% (8 of 22) were centrally obese (waist circumference, cms) and almost half (24 of 49) were cigarette smokers (Table 1).
Table 1. Characteristics of survey respondents and presence of CHD risk factors as recorded at the time of discharge from hospital*
|
Age at MI |
|
Sex |
|
|
Sample size |
58 |
Female/Male
|
19/52 |
|
Mean, ±
|
52.4 ± 8.3 |
|
|
|
Deprivation Category |
|
Alcohol (units/wk) |
|
|
Sample size |
62 |
Sample size |
68 |
|
Median [IQR] |
6.0 [4-7] |
Mean, ± |
9.2 ± 15.7 |
|
1-2 (affluent) |
5 |
Median [IQR]
|
4.0 [0-11] |
|
3-5 |
18 |
|
|
|
6-7 (deprived)
|
39 |
|
|
|
Body Mass Index |
|
Total Cholesterol |
|
|
Sample size |
49 |
Sample size |
48 |
|
Mean, ±
|
28.8 ± 6.0 |
Mean, ±
|
5.6 ± 1.2 |
* sample size reflects the data documented at discharge.
Illness Representations (IPQ-R)
The cause of the MI was attributed to a number of factors (Mean 4.7 ± 3.9). Stress or worry, and hereditary factors were reported as causal by more than half (n=44). Of 69 who ranked causal attributions according to importance, 23 (33%) indicated hereditary factors and 17 (24%) smoking. A wide range of symptoms were experienced and attributed to the MI (illness identity), in particular, fatigue, loss of strength and breathlessness. A greater number of symptoms tended to be reported by those with lower attendance at CR, but neither the number nor the type of symptom differed significantly by level of attendance (p > 0.05, Fisher-Freeman-Halton exact). Women reported more symptoms than men (Mean 7.3 ± 3.2 vs 5.3 ± 3.5, p = 0.028).
Scores from all dimensions of the IPQ-R are reported in Table 2. As illustrated, perceived control, consequences, and acute/chronic timeline scores were relatively high indicating that the heart problem was perceived as a chronic, controllable condition with strong negative consequences. Emotional representations were high.
Table 2. Distribution of scores for each dimension of the IPQ-R in the Survey Population
|
IPQ-R Dimensions |
Sample size |
Possible scores |
Mean (SD) |
Range |
|
Illness identitya |
72 |
≥ 0 |
3.4 (3.1) |
0 - 13 |
|
Causal attributions b |
72 |
≥ 0 |
4.7 (3.0) |
0 - 11 |
|
Acute/chronic Timeline c |
70 |
6 - 30 |
22.3 (4.8) |
12 - 30 |
|
Consequences d |
71 |
6 - 30 |
20.6 (4.9) |
9 - 30 |
|
Personal control e |
71 |
6 - 30 |
22.6 (4.3) |
10 - 30 |
|
Treatment control f |
71 |
5 - 25 |
17.6 (2.9) |
9 - 21 |
|
Illness coherence g |
72 |
5 - 25 |
16.7 (4.9) |
7 -25 |
|
Cyclical timeline h |
72 |
4 - 20 |
10.3 (3.9) |
4-20 |
|
Emotional representationsi |
72 |
6 - 30 |
18.4 (6.1) |
6 |
Greater number of symptoms = stronger illness identitya, Number of causal factors attributed to the heart problemb. Higher scores = stronger belief that illness is chronic in naturec, has more serious consequencesd, can be controlled by one’s own actionse, that treatment is effectivef, personal understanding of the condition is perceived to be goodg, that symptoms are cyclical or unpredictable in natureh and that the illness invokes more negative emotionsi
There was no statistically significant difference in any of the dimensions measured when groups were compared by CR attendance level. However, as seen in Table 3, those with the lowest attendance had poorer illness coherence, control, consequences and emotional representation scores than those with the highest level of attendance.
Table 3. Mean IPQ-R scores by level of attendance at cardiac rehabilitation
|
IPQ-R Dimensions
|
Cardiac Rehabilitation Programme Attendance Level |
||||||||
|
Group 1 <25% (n=21) |
Group 2 25%-75% (n=8) |
Group 3 >75% (n=33)
|
|||||||
|
|
Mean (SD) |
p-value Group 1 vs Group 2 |
Range |
Mean (SD) |
p-value Group 2 vs Group 3 |
Range |
Mean (SD) |
p-value Group 1 vs Group 3 |
Range |
|
Personal control |
21.6 (4.7) |
0.90 |
10-29 |
23.2 (4.2) |
0.97 |
18-30 |
22.9 (3.9) |
0.81 |
16-30 |
|
Treatment control |
16.9 (3.1) |
0.86 |
9-23 |
17.5 (3.2) |
0.97 |
12-21 |
17.9 (3.1) |
0.50 |
19-25 |
|
Consequences |
21.2 (4.7) |
0.28 |
10-29 |
22.5 (5.7) |
0.85 |
13-30 |
19.8 (4.7) |
0.49 |
9-27 |
|
Illness coherence |
16.9 (5.2) |
0.99 |
9-25 |
23.2 (4.2) |
0.93
|
11-25 |
17.0 (4.8) |
0.99 |
6-25
|
|
Acute/chronic timeline |
22.7 (5.1) |
0.84 |
19-30 |
23.4 (4.6) |
0.88 |
14-30 |
22.4 (5.1) |
0.99 |
12-30 |
|
Cyclical timeline |
11.6 (4.8) |
0.99 |
4-20 |
11.2 (3.3) |
0.30 |
8-16 |
9.2 (3.3) |
0.21 |
4-19 |
|
Emotional representations |
19.2 (7.1) |
0.96 |
7-30 |
18.1 (5.2) |
0.97 |
12-25 |
17.5 (6.0) |
0.82 |
6-30 |
Women scored lower on illness coherence than men (Mean 14.4 ± 4.6 vs 17.8 ± 4.7, p = 0.01).
Heart Disease Quality of Life (MacNew)
Almost all respondents (n=69, 92%) reported being ‘low in energy’ at the time of the survey; almost half feeling so ‘a good bit’ or ‘all’ of the time (n=30). Approximately 2 in 3 (n=49, 67%) were short of breath when performing daily activities and more than half (n=39, 53%) were experiencing chest pain. Overall, those with the poorest level of CR attendance had the poorest quality of life scores across all dimensions (Table 4) but the difference was not statistically significant.
Table 4. Mean HRQoL (MacNew) scores by level of attendance at cardiac rehabilitation
|
MacNew Dimensions
|
Cardiac Rehabilitation Programme Attendance Level |
|||||
|
Group 1 <25% (n=21) |
Group 2 25%-75% (n=8) |
Group 3 >75% (n=33) |
||||
|
Mean (SD) |
p-value Group 1 vs Group 2 |
Mean (SD) |
p-value Group 2 vs Group 3 |
Mean (SD) |
p-value Group 1 vs Group 3 |
|
|
Emotion |
4.5 (1.6) |
0.97 |
4.5 (1.6) |
0.51 |
5.3 (1.4) |
0.17 |
|
Physical |
4.5 (1.7) |
0.85 |
4. 7 (1.9) |
0.73 |
5.3 (1.6) |
0.10 |
|
Social |
4.7 (1.6) |
0.35 |
4.7 (1.9) |
0.99 |
5.6 (1.5) |
0.05 |
|
Global
|
4.5 (1.6) |
0.97 |
4.7 (1.8) |
0.55 |
5.4 (1.4) |
0.11 |
Women had poorer QoL scores than men, significantly so in the emotional (p=0.02) and global dimensions (p=0.049).
Anxiety and Depression (HAD)
Mean anxiety and depression scores were higher than normative data from the general UK population (Anxiety 7.2 ± 5.3 vs. 6.14 ± 3.76; Depression 5.6 ± 5.2 vs. 3.68 ± 3.07)39. The percentage of scores indicative of both ‘moderate’ and ‘severe’ anxiety (16.7% and 11.1% vs. 10% and 2.6%) and depression was also higher (8.3% and 9.7% vs. 2.9% and 0.7% respectively).
Those with the lowest attendance at CR had higher depression scores compared to those with the highest attendance (p=0.002) (Table 5).
Table 5. Anxiety and Depression (HAD) scores by level of attendance at cardiac rehabilitation
|
|
Cardiac Rehabilitation Programme Attendance Level |
|||||
|
|
Group 1 <25% (n=22) |
Group 2 25%-75% (n=8) |
Group 3 >75% (n=33)
|
|||
|
|
Mean (SD) |
p-value Group 1 vs Group 2 |
Mean (SD) |
p-value Group 2 vs Group 3 |
Mean (SD) |
p-value Group 1 vs Group 3 |
|
Anxiety
|
8.4 (5.9) |
0.57 |
7.9 (5.3) |
0.98 |
5.8 (4.6) |
0.26 |
|
Depression |
7.8 (6.0) |
0.32 |
6.7 (5.9) |
0.85 |
3.8 (3.7) |
0.02* |
*significant
Women had higher anxiety (p=0.025) and depression (p<0.001) scores than men with a greater proportion indicative of clinical caseness (anxiety 0.55 vs. 0.36%, p=0.18; depression 0.45 vs. 0.24, p=0.09).
Pictorial Representation of Illness and Self-Measure (PRISM+)
Twenty-four participants completed the PRISM+ task. From a possible self-illness separation distance (SISD) (perceived burden of illness) of 0-27cms, a mean of 13.7 ± 8.3 was calculated. SISD did not differ significantly across CR attendance groups (p=0.89), but the poorest attenders had the greatest SISD. For some the perceived burden of illness, as measured by SISD, was greater than other issues identified, while for others it was less. This was demonstrated graphically in the placement of the discs and, as illustrated in the exemplars and expounded in the interviews (see Table 6).
Table 6. Excerpts from the interview narratives supporting the theme of ‘Loss’
|
Losing Control
|
“…It’s been frustrating for me. This could have been all sorted years ago... Because ah think if I got a stent in, even one, but (doctor) says (I’ve) got a wee branch off. If [they did] this it’s really risky, [I] could take another heart attack. Or a stroke. Which I understand. But I’m willing to risk that. Just to get me better. But he (doctor) says ‘No’…” [John 070, Male, CRPA < 25%] |
|
Losing Self Esteem
|
“...I went to the rehabilitation here which was really, really good. But I’m no[t] one for sticking to going every week. I don’t like being told “You’ll go”. But what I do, do, I do it myself... Different days... I go to the sauna and I go to the gym. And I do different things... but as ah say I think its – ah don’t like being telt (told) being there at such and such a time an – [I] like to do things my own way...” [Simon 063: Male, CRPA >75%] |
|
|
“...I felt so em – looking at all these [old] people. I don’t mean that badly, what I mean is like 60, 70 year aulds – and they are [all doing] their best – people wi[th] strokes, and managing a lot better than what [I] could. So. I felt “Oh my God” “Look at the state of you an all these poor souls is worse than you. (LP). ..They’ve managed it...They have managed on bikes. Me, I couldn[t]. I was (sp), as ah was saying there were people with maybe... one hand and – do you know where I’m coming [from]? Even though – [doing all] this - so there is me (voice quieting) I felt - how did I feel - I felt worthless, I felt really worthless. That is how I felt.” [Mary 060: Female, CRPA <25%] |
|
Losing Confidence |
“…To be perfectly honest I didn’[nt] think I would ...get anywhere near the 16 stone... but I did and that [motivated] me...that I was losing it …But then when I found out how much I did lose, I started to panic because just before my [mum] died she lost a hell of a lot of weight. It fell off her. And I thought - Oh [no]. This [weight] has went away too quick. Well that [frightened] me”. [Allan 045: Male, CRPA > 75%]. |
|
Losing Progress
|
“…the medication for its own purpose slows your heart rate down - only allows it to go to a certain level. To my mind if that’s doing that, your whole metabolism is obviously slowing down so you can only achieve so much and I found that myself.... when I was doing some running I was doing quite well. But .... I could only exercise a certain amount of time. I could only run for a certain amount of time and then its like ..., hitting a big brick wall, and I couldn’t lose any more (weight)...” [Janet 091: Female, CRPA >75%] |
|
“...I can do...I can go on the treadmill for twelve minutes no problem but I still [can’t] lose weight. I blame the beta blockers for that. ‘[Be]cause I was never as heavy as this ‘till I took my heart attack. And I told the doctor that. I said - What do you want us to go to gyms all the time for when it’s the beta blockers that’s causing us to (put) weight on...? [I] took them all [tablets]...[except] the Beta Blockers. The Beta Blockers were banned from snooker players for slowing them down. The snooker players got banned from using them [them because] it slows the metabolism... For the players it slows their game down. That’s the only game it gets banned from.” [Andrew 077: Male, CRPA >75%] |
|
|
Losing Support |
“… I looked them up (prescribed medications) on the internet and they all had the same side effect of lowering your blood pressure. When I went to see the Consultant (the Consultant) argued about it - ‘They do different things’. I said, but my blood pressure is dangerously low. That was it. ‘Right stop’. No explanation as to why. Just stop them...‘I won’t see you again’ …I (was) told ...I would go every six weeks then ... three months then ... every six months. But that was it.” [Jim 087: Male, CRPA <25%] |
|
|
“... I had a lot of problems with Ramipril ...I went to the hospital to let them change it and eh.. I was put on (a different tablet) - same with that - so (the GP) just stopped it...then my blood pressure was up and I had nobody to – I had to wait until I went to the hospital. So I took it upon myself to go onto the Internet and books and I turned to supplements and other stuff and … I brought it (blood pressure) down from over 140 to 110... [Gordon: 050 Male, CRPA <25%] |
Clinical Assessment
The number exceeding recommended risk reduction targets in those who underwent clinical assessment (n=24) were as follows: SBP=2, DBP=3, plasma total cholesterol=4, BMI=12, central obesity =17. All but two of the smokers had continued to smoke or re-started.
The Participants’ Perspectives
As illustrated, ‘Loss’ was the predominant longer-term issue (Figure 5). The exemplars from the interviews substantiate this finding and provide some insight into the perceived longer-term consequences of the MI and ability to maintain health and positive lifestyle behaviours (Table 6). Despite strong beliefs that they could control their heart problem, participants perceived the MI to have longer term consequences that went beyond physical limitations. Many believed they lacked the appropriate internal or external resources to overcome the challenges they faced. Issues impacting on ability to maintain health or positive health behaviours were attributed to lack of access to appropriate, timely or adequate support, concomitant health problems, financial, family, or environmental concerns, and worries about medications or the future. This was supported by the results of the PRISM+ task where the MI was perceived to be less of a ‘burden’ than some of the other challenges encountered. Emotional distress and lack of understanding about the MI was frequently expressed.
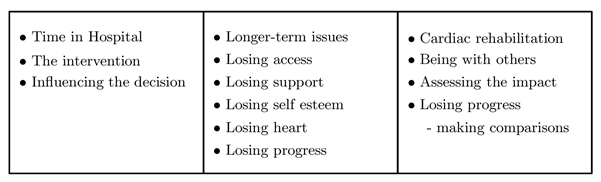
Figure 5: Excerpt from the coding categories identified from the interviews
Cardiac drugs were considered essential, but concerns were raised that they were ‘overcorrecting’ blood pressure or cholesterol, or that they were slowing the metabolism to such an extent that attempts to increase activity or prevent excessive weight gain were being impeded, or that they were ‘overcorrecting the problem for which they had been prescribed. Thus loss of weight as well as inability to lose weight, low levels of activity as well as high levels of activity, low blood pressure as well as high blood pressure resulted in a loss of confidence regarding the actions being taken, and, in some cases, the support of their health care professional (Table 6).
Discussion
The diversity in health perspectives are outlined in the results sections for each of the validated measures/scales used and the scope of multiple measures of health and well-being of individuals living with heart disease illustrated. The range of variables measured includes quantitative measures and qualitative perspective, an advocated means of capturing a closer view of reality40.
Interviews are an appropriate way of eliciting a person’s beliefs about their illness and identifying coping processes11,41. In this study, they also accommodated the dimensions of the SRM model not included in the IPQ-R. The PRISM approach highlights a synthesis between qualitative and quantitative data sources40 and perhaps a more individualised perspective of health determinants and values. Each of these methods has been shown to have a place across the complex landscape of health and wellness. In terms of the application of the different health measurement perspectives, their outputs indicated that, overall, participants perceived their heart problem to be chronic in nature. Men believed they had a good understanding of their heart disease, women less so. Despite a strong belief that the heart problem could be controlled, it was perceived as having negative consequences for them and their families.
Illness representations influence, and are influenced by, the actions individuals take to restore health. Many respondents in the current study found it difficult to sustain positive lifestyle changes. Some attributed the symptoms they were experiencing to the effects, or inefficacy, of their medications or the lifestyle changes they had made. There may be a ‘tipping point’ whereby the person taking action perceives the outcome of that action to have shifted from being beneficial to potentially harmful. In this study, factors perceived to have negatively impacted on positive action were embodied within the sense of loss experienced that seemed to permeate many aspects of their life. This may provide some explanation as to why more negative illness representations result in poorer outcomes25.
Anxiety and depression are well recognised mood disorders in cardiac patients. Van Dijk et al42 found depression and anxiety to be independently associated with an increased risk of all cause mortality (77% and 50% respectively) in patients 10 years post PCI, with depression being the primary contributor. A comparison of cardiac patients at 7 years post PCI reported similar results, with all cause mortality 23% in depressed patients compared to 12.2% in those who were not depressed43. The pathways are not fully understood, but a range of factors have been implicated, including physiological, biological and behavioural. The impact of post cardiac life events on mood disorders may also contribute to outcome and should be investigated42.
It has been suggested that women experience wider ranging and more subtle symptoms than men and so may be missed44. In our study, women fared worse than men overall. As a traditionally, under-represented group in relation to CHD research, this issue needs to be addressed and calls into question the potential under-representation of women in the data reported.
It is recognised that patient reported health outcome instruments exist but that more education for clinicians on their value and interpretability, as well as a more streamlined approach to their implementation in the clinical setting, is necessary45. This study facilitated a full exploration of health data highlighting the complexity of the subject, and where further exploration may be needed and/or interventions considered.
The study provides a unique insight into the use of a range of health perspectives using validated quantitative measures such the HADS as well as qualitative narratives from interviews. We believe that this is the first time these methods have been used in conjunction with the PRISM+ tool; an instrument that has the ability to provide both qualitative and quantitative data. The interviews and PRISM+ task revealed issues that, otherwise, would have remained undisclosed. Cumulatively, the outcome measures provided access to patients' perspectives on the impact life events had on their overall health and well-being. Because the same participants completed each assessment, the output from the measures is not contaminated by different participant perspectives. This permits the range of information generated by the tools themselves to be compared directly and illustrates their utility in practice.
Conclusion
The results from the range of measures used in this investigation highlight the unmet health need in this population. As demonstrated, the perceived consequences and sense of loss associated with the MI remained high up to three years after diagnosis, despite a strong sense that the heart problem could be controlled. To date, the success of CR programmes may have been limited due to the perceived consequences and longer-term concerns of MI sufferers. More innovative and effective approaches are needed to support people to adopt and maintain positive health behaviours following diagnosis. In particular, more consideration needs to be paid the needs of women, a group who have, traditionally, received less attention than men with regard to CHD. Patient reported outcome measures are important tools although many fail to fully convey the patient’s perspective. The tools used in this study appear useful in unravelling the complexity of patients’ views of their health and well being, and may provide an opportunity to track changes over time and across interventions.
Acknowledgement
The authors wish to acknowledge the support of Graduate Studies and Scientific Research and the Deanship of the School of Nursing at Umm Al-Qura University.
References
- WHO, 2017 World Health Organisation. Available at: https://www.who.int/news-room/fact-sheets/detail/cardiovascular-diseases-(cvds) (Accessed March 2020).
- NHS ISD 2019 National Services Scotland, Information Services Division. Available at: https://beta.isdscotland.org/find-publications-and-data/conditions-and-diseases/heart-disease-and-blood-vessels/heart-disease-statistics (Accessed March 2020).
- NHS ISD 2010 National Health Service, National Services Scotland, Information and Statistics Division [Internet]. Available at: http://www.isdscotland.org//isd/information and-statistics (Accessed 2010).
- Laxmi S. Acute Myocardial Infarction in Women. AHA Circulation. 2016; 133: 916-947. Available at: https://doi.org/10.1161/CIR.0000000000000351 (Accessed March 2020).
- Hall M. Multi-morbidity and survival for patients with acute myocardial infarction in England and Wales: Latent class analysis of a nationwide population-based cohort. PLOS Medicine. 2018. Available at: https://doi.org/10.1371/journal.pmed.1002501 (Accessed 2020)
- BHF 2020. British Heart Foundation, UK Fact Sheet. bhf-cvd-statistics-uk-factsheet.pdf (Accessed April 2020).
- Tolmie EP, Lindsay GM, Belcher PR. Coronary artery bypass graft operation: Patients' experience of health and well-being over time. European Journal of Cardiovascular Nursing. 2006; 5(3): 228-236.
- Wilkinson R, Marmot M. Social Determinants of Health: the solid facts. 2nd ed. World Health Organisation Europe. 2003.
- Höfer S, Doering S, Rumpold G, et al. Determinants of health-related quality of life in patients with coronary artery disease, European Journal of Cardiovascular Prevention & Rehabilitation. 2006; 1(3): 398-406.
- Furze G. Angina rehabilitation: exercise is not enough, Procedia - Social and Behavioral Sciences. 2010; 5: 1545-1549.
- Leventhal H, Meyer D, Nerenz D. “The common sense representation of illness danger”. In Contributions to Medical Psychology S. Rachman (ed.), Pergamon Press New York. 1980; 11: -30.
- Leventhal H. Findings and theory in the study of fear communications. Advances in Experimental Social Psychology. 1970; 5: 119-186.
- Leventhal H. Illness cognition: using common sense to understand treatment adherence and affect cognition interactions”. Cognitive Perspectives in Health Psychology. 1992; 16(2): 43-163.
- Büchi S, Villiger P, Kauer Y, et al. “PRISM (Pictographic Representation of Illness and Self Measure) - a novel visual method to assess the global burden of illness in patients with systemic lupus erythematosus” Lupus. 2000; 9(5): 368-373.
- Tolmie EP, Lindsay GM, Kelly T, et al. Are older patients cardiac rehabilitation needs being met? Journal of Clinical Nursing. 2009; 18(13): 1878-1888.
- Weinman J, Petrie KJ, Sharpe N, et al. Causal attributions in patients and spouses following first-time myocardial infarction and subsequent lifestyle changes, British Journal of Health Psychology. 2000; 5: 263-273.
- Lau-Walker M. Relationship between illness representation and self-efficacy. Journal of Advanced Nursing. 2004; 48(3): 216-225.
- Brewer N, Chapman GB, Brownlee S, et al. “Cholesterol control, medication adherence and illness cognition” British Journal of Health Psychology. 2002; 7: 433-447.
- Whitmarsh. A, Koutantji M, Sidell K. “Illness perceptions, mood and coping in predicting attendance at cardiac rehabilitation”. British Journal of Health Psychology. 2003; 8: 209-221.
- Steed L, Newman SP, Hardman SMC. “An examination of the self-regulation model in atrial fibrillation, British Journal of Health Psychology. 1999; 4: 337-347.
- Heijmans M. “The role of patients’ illness representations in coping and functioning with Addison’s disease”. British Journal of Health Psychology. 1999; 4: 137-149.
- Fortune DG, Richards HL, Main CJ, et al. Pathological worrying, illness perceptions and disease severity in patients with psoriasis. British Journal of Health Psychology. 2000; 5: 71-82.
- Jessop C, Rutter DR. Adherence to asthma medication: the role of illness perceptions, Psychology and Health. 2003; 18(5): 595-612.
- Lawson VL, Bundy C, Lyne PA, et al. “Using the IPQ and PDMI to predict regular diabetes care-seeking among Type 1 diabetes”. British Journal of Health Psychology. 2004; 9: 241-252.
- Hoving JL, Van der Meer M, Volkova AY, et al. Illness perceptions and work participation: a systematic review Int Arch Occup Environ Health. 2010; 83: 595–605.
- Moss-Morris R, Weinman J, Petrie K, et al. “The revised illness perception questionnaire (IPQ-R)”. Psychology and Health. 2002; 17: 11-6.
- Snaith RP, Zigmund AS. The Hospital Anxiety and Depression Scale with the irritability- expression-anxiety scale and the Leeds situational anxiety scale manual. NFER-Nelson Pub Co Windsor. 1994.
- Höfer S, Lim L, Guyatt G, et al. “The MacNew Heart Disease health-related quality of life instrument: A summary”. Health and Quality of Life Outcomes. 2004; 2. Online Available at: www.hqlo.com/content/2/1/3. BioMed Central Open Access journals.
- Weinman J, Petrie KJ, Morris RM, et al. “The illness perception questionnaire: A new method for assessing the cognitive representation of illness”. Psychology & Health. 1996; 11(3): 431 - 445.
- Büchi S, Sensky T, Sharpe L, et al. “Graphic representation of illness: a novel method of measuring patients' perceptions of the impact of illness” Psychotherapy and psychosomatics. 1998; 67(4-5): 222-5.
- Büchi S, Sensky T. “PRISM: Pictorial Representation of Illness and Self Measure: A Brief Nonverbal Measure of Illness Impact and Therapeutic Aid in Psychosomatic Medicine Psychosomatics. 1999; 40(4): 314-320.
- Buchan IE. The Development of a Statistical Computer Software Resource for Medical Research. Thesis submitted in accordance with the requirements of the University of Liverpool for the degree of Doctor of Medicine. November 2000 Liverpool, England. 2000.
- Conover WJ. Practical Non-Parametric Statistics, 3rd edn, John Wiley & Sons, New York. 1999.
- Critchlow DE, Fligner MA. On distribution-free multiple comparisons in the one-way analysis of variance. Communications in Statistics – theory and methods. 1991; 20: 127-129.
- Hollander M, Wolfe DA. Non-parametric Methods (2nd edition). Wiley-Interscience, New York. 1999.
- Altman DG. Practical Statistics for Medical Research, Chapman & Hall, London. 1991.
- Ritchie J, Spencer L. “Qualitative data analysis for applied policy research”. In: A. Bryman and G. & D. Burgess D. (eds), Analysing Qualitative Data. Academic Journal Routledge London. 1994; 173-194.
- Richards L. Using NVIVO in Qualitative Research (Advances in Experimental Medicine and Biology) Sage Publications, London. 1999.
- Crawford JR, Henry JD, Crombie C, et al. “Brief report: Normative data for the HADS from a large non-clinical sample” British Journal of Clinical Psychology. 2001; 40: 429-434.
- Pope C, Mays N, Popay J. Synthesizing Qualitative and Quantitative Health Evidence: A Guide to Methods Wiley 2008. 2007. https://doi.org/10.1111/j.1467-9566.2007.1077_5.x
- Leventhal H, Nerenz DR. “The assessment of illness cognitions”, in Measurement Strategies in Health Psychology, P. Karoly (ed.) John Wiley New York. 1985; 517-554.
- Van Dijk M.R, Utens EMW, Dulfer K, et al. Depression and anxiety symptoms as predictors of mortality in PCI patients at 10 years of follow up. Eur J Prev Cardiol. 2016; 5: 552-8.
- Damen NL, Versteeg H, Boersma E, et al. Depression is independently associated with 7-year mortality in patients treated with percutaneous coronary intervention: results from the RESEARCH registry. Int J Cardiol. 2013 Sep 10; 167(6): 2496-501. doi: 10.1016/j.ijcard.2012.04.028. Epub 2012 May 3. PMID: 22560933.
- Canto JG, Rogers WJ, Goldberg RJ. Association of Age and Sex with Myocardial Infarction Symptom Presentation and In-Hospital Mortality. JAMA. 2012. Available at: https://jamanetwork.com/journals/jama/article-abstract/1355992 (Accessed April 2020).
- Kelkar AA, Spertus J, Pang P, et al. Utility of Patient-Reported Outcome Instruments in Heart Failure Journal of the American College of Cardiology: Heart Failure. March 2016; 4(3). DOI: 10.1016/j.jchf.2015.10.015.