
Commentary on the "Increasing gap in man height between rich and poor countries linked to the ingest of nitrogen and phosphorus". Implications for heart health
Penuelas, J1,2* & Sardans, J1,2*
1 CSIC, Global Ecology Unit CREAF-CEAB-UAB, Cerdanyola del Vallès, 08193 Catalonia, Spain
2 CREAF, Cerdanyola del Vallès, 08193 Catalonia, Spain
Abstract
Rich countries have higher per capita food N and P intake than poor countries. This difference translates into higher human height. The differences among countries provide additional evidence on geopolitical disequilibrium in human wellness distribution but it also may have consequences on the incidence of hearth health. More N and P fertilizer sources are necessary, and they have to be adequately used in poor-countries to solve this additional gap between rich and poor countries.
A recent study of Peñuelas et al. (2017)1 has quantified and identified the role of the N and P content in foods intake by humans and their distributions among foods of animal or vegetal origin on adult men height among different countries and the associated geo-economical and healthy implications. This study identified the role of N and P contents and the N:P ratio of annual food intake per capita among distinct countries in explaining the increasing gap that exist in man height between rich (developed) and poor (undeveloped and developing) countries based in the N and P contents, and N:Pratio, in annual per capita food intake.
This study was based in the statistical analyses of data coming from human height food intake, Gross Domestic Product (GDP), Human Development Index (HDI), % of low weight infants at birth and percentage of urban population and per capita calories intake databases from FAO (2014), DTU (2016), USDA (2016), INFOODS (2013), the Universität Tübingen (2016), World Bank and Human Development Programme (2016). Two groups of countries were identified and compared. The first group was formed by countries with more animal- than vegetable-derived food N and P intake coinciding mostly with countries with absolute higher N and P annual per capita intakes and with rich countries. The second group was formed for the countries with more plant- than animal-derived N and P intake, coinciding with countries with less total N and P annual per capita intake and with developing and undeveloped countries.
This study hypothesized that the increasing gap of man height average differences between rich with respect to poor countries was related to higher N, P and N:P ratio annual per capita intake. Proteins, amino acids and nucleic acids are the main sources of N in foods (Tomé and Bos, 2000; Smil, 2002)2,3 whereas P comes mainly from cell membranes, P bonded to proteins, nucleic acids, and phytates, the latter less absorbed in gut (Gutierrez et al. 2013)4. Thus, the main aim of this study was to test the hypothesis that adequate intakes of N and P are needed for the cell molecular machinery to have fast capacity of protein synthesis and thus fast growth (Main et al., 1007; Sterner and Elser, 2002)5,6. Thus this suppose that an adequate intake of foods containing these elements is necessary to express all the genetic organism potential for growth during organism’s growth age in humans. Several other studies strongly support these commented hypotheses although they have not been directly tested. For example, the infants weight at born have been positively correlated with mother P concentration in blood during gestation (Mataloun and Leone, 2000)7, growth rate of recent-born infants has been correlated with P concentration in mother milk (Khorana and Jiamsajjamongkhon 2014)8 and high capacity of infants to retain N in body have been linked to rise in growth rates (Dempsher et al., 1990)9.
The results firstly showed that on average men of developed countries were taller, had higher N and P intakes from animal than from vegetal food and total higher N and P and N:P intake (Table 1, Figure 1). Men born in the 1980s, had a difference of 23 cm. of adult men height between the countries with tallest heights and the countries with shortest adult men. Univariant mixed models, multivariate analyses and Bayesian statistical analyses all them showed that the difference of the average adult men height among countries along the three studied cohorts (born in 1960s, 1970s and 1980s) was most associated with N, P and N:P intake than to other possible explanatory variables, such as calories intake, or country richness or wellness indexes. Effectively, the study also detected that some other factors such as HDI, or the % of infant low weight at birth also explains some part of the results and reinforced the main role of N, P and N:P intake. Human height is a quantitative trait controlled by multiple genes and is one of the most heritable human traits (Fisher, 1918, Lettre, 2011, but it also depends on several environmental factors (Lettre, 2011; Deaton et al., 2007; Silventoinen et al., 2000; Haeffner et al., 2002)10,11,12,13. Nutrition, and thus the intake of the main bio-elements, N and P, during the growth period, is determinant for the final reached height in adult period. The amounts of N and P ingested are strongly related with the quantity of proteins and nucleic acids the material directly involved in protein anabolism capacity and thus with growth. An adequate intake of these two bio-elements should be a key factor in developing the maximum genetic potential capacity to growth of organisms, including humans. In the 80 countries included in the study the tallest adult men were found in Denmark and Netherlands (183 cm on average), whereas the shortest men were found in Guatemala and Vietnam, 160 cm (Table 1). When comparing the adult men born in 1960s with those born in 1980s, the largest increases in height average in 1980s generation versus 1960s generation was observed in Japan with 7 cm of increase followed by Denmark and Portugal (3 cm). In the other end, the most negative change in adult men height between 1960s and 1980s generations was observed in Togo (- 3 cm) followed by Madagascar (- 2 cm). The adult men height in rich countries grew by 1.5 cm from 1960s to 1980s, whereas it did not change in poor countries (Figure 2). These differences in adult men height when comparing man cohorts of 1980s and 1960s in developed countries was linked with the increases of annual N intake 2.3 ± 0.4 kg y-1), of annual P intake (0.17 ± 0.03 kg y-1) and intake N:P ratio (0.3 ± 0.08 kg y-1), whereas in poor countries the increase of N (0.7 ± 0.2 kg y-1) and P (0.08 ± 0.02 kg y-1) were scarcely significant, and no changes in N:P were observed (Figure 2). This lack of increases of N and P intake in poor countries, such as several African countries, occurred in parallel with a decreasing trend in adult men height.
Table 1: Adult human height of the cohort of 1980s in different countries. Data from University of Tübingen-world height databases (www.uni-tuebingen.de).
| Country | Height (cm) |
| Bangladesh | 162.40 |
| Belgium | 178.80 |
| Bolivia | 164.20 |
| Botswana | 176.10 |
| Brazil | 171.70 |
| Burkina | 172.80 |
| Cabo Verde | 169.00 |
| Cambodia | 162.50 |
| Cameroon | 171.00 |
| Canada | 179.60 |
| Chad | 173.30 |
| Chile | 173.10 |
| China | 171.50 |
| Colombia | 170.60 |
| Congo | 168.40 |
| Denmark | 183.20 |
| Djibouti | 168.90 |
| Egypt | 171.30 |
| Finland | 178.20 |
| Gabon | 169.70 |
| Germany | 180.50 |
| Ghana | 170.00 |
| Greece | 177.30 |
| Guatemala | 160.80 |
| Guinea | 169.50 |
| Guyana | 170.50 |
| Haiti | 171.50 |
| Honduras | 164.70 |
| India | 164.40 |
| Indonesia | 164.00 |
| Iran | 172.40 |
| Ireland | 176.60 |
| Italy | 174.50 |
| Jamaica | 173.60 |
| Japan | 171.70 |
| Jordan | 170.30 |
| Kenya | 171.20 |
| Lesotho | 167.40 |
| Liberia | 167.30 |
| Madagascar | 162.90 |
| Malawi | 166.20 |
| Mali | 172.20 |
| Mexico | 167.80 |
| Morocco | 170.30 |
| Mozambique | 165.20 |
| Myanmar | 161.30 |
| Namibia | 171.30 |
| Nepal | 163.00 |
| Netherlands | 182.70 |
| Nicaragua | 166.40 |
| Niger | 170.70 |
| Nigeria | 169.50 |
| Norway | 179.70 |
| Panama | 170.00 |
| Peru | 164.20 |
| Philippins | 165.60 |
| Portugal | 172.10 |
| Korea | 171.90 |
| Rwanda | 167.20 |
| Senegal | 174.30 |
| Sierra Leona | 165.80 |
| South Africa | 168.10 |
| Spain | 175.60 |
| Sri Lanka | 165.80 |
| Swaziland | 170.20 |
| Sweden | 180.40 |
| Togo | 167.70 |
| Trinidad | 174.40 |
| Uganda | 169.30 |
| United Arab emirates | 169.10 |
| United Kingdom | 176.80 |
| Tanzania | 166.90 |
| USA | 179.00 |
| Viet Nam | 160.00 |
| Yemen | 167.60 |
| Zambia | 168.20 |
| Zimbabwe | 171.00 |
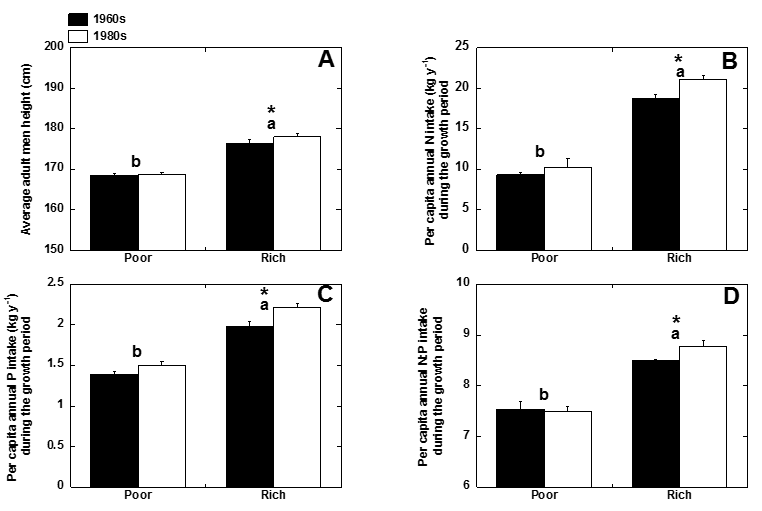
Figure 1: Adult men height, annual per capita N and P intake, and annual per capita N:P intake (during growth period) of the cohorts of men born in 1960s and 1980s in rich (white) versus poor countries (black). Data from University of Tübingen-world height databases (www.uni-tuebingen.de) and FAO. Different letters indicate statistical significant differences (P< 0.05) in the same cohorts between rich and poor countries, (*) means statistic significant differences (P< 0.05) between different cohorts within rich or poor countries.
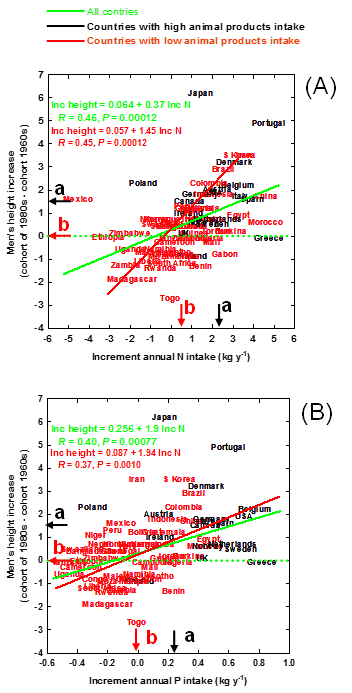
Figure 2: Relationships of the change in adult male height (cm) from the 1960s cohort to the 1980s cohort in the countries with the increase in annual N (a) and P (b) intake during the growth period (1960s-1980s for the 1960s cohort, and 1980s-2000s for the 1980s cohort). Black arrows represent rich countries, and red arrows represent poor countries. Different letters on the axes indicate significant differences (P<0.05).
These increasing gaps associated with a different trend in the changes in N and P intake between developed versus undeveloped and developing countries was also associated with the fact that rich countries have increased the proportion of N and P coming from animal with respect to vegetal food sources in the last decades, and this changing trend was not observed on average in poor countries. This has a direct effect on food intake N:P ratio since food of animal origin has, on average, higher N, and P concentrations and high N:P ratios than the food of vegetal origin. Certainly, other factors can also explain in some cases the changes in adult human height between the two commented men cohorts, such could be the case of Japan, with an increase of 7 cm much above the expected by the overall relationships between height and N, P and N:P intake.
These differences and changes in men height have an overall potential importance at health, sociological and geo-political scales. Height is not a neutral human trait. Higher adult men height in several geopolitical regions is associated with higher incidence of colorectal and possibly with pancreatic and prostate cancers despite the inverse relationships of height with body mass index (Green et al., 2011; World Cancer Research Foundation 2007; Davies el al., 2015; NCD-RISC, 2016)14,15,16,17. On the other hand, adult height has been related with less probability of cardiovascular caused mortality (Green et al., 2011; Davies el al., 2015)14,15. Moreover, higher height has also been associated with low mortality in middle and older ages in some countries with consistent data of mortality (NCD-RISC, 2016)17.
Recent studies have observed different relationships between human height and the prevalence of different heart diseases. Whereas atrial fibrillation, Marfan syndrome, abnormalities in the aorta and mitral valve prolapse are associated positively with human height, congestive heart failure, coronary artery disease and aortic valve calcification are less prevalent in taller people (Rosenbush and Parker, 2014). Nüesch et al., (2016)18,19 conducted in a Mendelian randomized meta-analysis of data from 21 studies of cardiovascular risk factors with 60,028 participants and found a lower cardiovascular risk factors associated with the higher height that in turn was associated with lower values of body mass index, triglycerides and cholesterol blood concentrations and systolic blood pressure. In this line, Nelson et al. (2015)20 tested the association between genetically determined height with the risk of coronary artery disease (CAD) in 65,066 cases and 128,383 controls observing a relative increase of 13.5% (95% confidence interval from 5.4 to 22.1; P<0.001) in the risk of CAD per 6.5 cm decrease in genetically determined height. This link of height with cardiovascular diseases warrants further research to disentangle possible direct effects of height on heart health from indirect effects through the associated conditions (better diet, low mass index,…) underlying this likely association between the higher height and heart health.
The study of Peñuelas et al. (2017)1 also prevents to establish and extrapolate the observed associations when comparing different countries or socio-economic regions. Certainly, the overall analysis supports the hypothesis that the increases in N and P intakes in rich countries favors the fast protein synthesis and thus facilitate the maximum genetic capacity to grow, but several other differences among countries very probably exert also some effect. Developed countries frequently are associated with better accessibility to sanitary services and other important services that can affect directly more to other variables that growth, such as life expectance or health, but that indirectly could also be related to differences in the growth capacity as for example improving the health during the growth period. The statistical results of the study drive to the conclusion that the relationships between socio-economic variables and the gap of human height between rich- and poor-countries is mostly due to their indirect effects through per capita N, P and N:P intake.
The study concluded that the increase of N and P intake are even more important than the increases in calories intake. Then, the more varied diet with the higher N and P intake is a key factor to improve food quality in poor countries. At global scale, this implies the increase of animal-derived food production, which by itself has several sustainable draw backs including inefficiency to produce the sufficient N, P and calories for global food production for humans (Tilman and Clark, 2014)21 and/or to increase the N and P rich vegetable crops for direct human consume. A diet consisting of more food intake from animal origin combined with more N- and P-rich and varied vegetable crops intake would be the solution for poor countries to solve the commented gap. Also, a shift from food animal sources towards more intake of N- and P- rich vegetable food sources in rich countries would help to the sustainability of crop production at global scale without decreasing the potential genetic capacity of developed countries to take profit of all their still genetic potential to even reach higher heights of adult population.
All these possibilities depend on the capacity of countries to use more N and P fertilizers, especially in poor countries. For N-rich crops, N fertilization may not be the problem (Peñuelas et al., 2013)22. But most soils at the global scale are poor in P concentrations, so P fertilizer inputs are fundamental to improve the situation. This is a key challenge for humanity, since most P-fertilizer sources come from mining with finite sedimentary deposits of phosphorite that moreover are located only in few countries (Cordell and White, 2011; Elser and Bennett, 2011; Obersteiner et al., 2013; Peñuelas et al., 3013)23,24,22. The current growing population of humans and livestock together with the rise in biofuels production could decrease P reserves (Cordell and White, 2011; Elser and Bennett, 2011; Obersteiner et al., 2013)23,24,22. Further studies and new methods of implementation to recycle P and to increase P-use efficiency, and policy initiatives in a global food security are warranted.
References
- Peñuelas J, Janssens IA, Ciais P, et al. Increasing gap in human height between rich and poor countries associated to their different intakes of N and P. Scientific Reports. 2017; 7: 17671.
- Tomé D, Bos C. Dietary Protein and Nitrogen Utilization. J Nutr. 2000; 130: 1868–1873.
- Smil V. Nitrogen and Food Production: Proteins for Human Diets. AMBIO A J Hum Environ. 2002; 31: 126–131.
- Gutiérrez O. Sodium and phosphorus- based food additives: persistent but surmountable hurdles in the management of nutrition in chronic kidney disease. Adv Chronic Kidney Dis. 2013; 20: 150–156.
- Main TM, Dobberfhul DR, Elser JJ. N:P stoichiometry and ontogeny of crustacean zooplankton: A test of the growth rate hypothesis. Limnology and Oceanography. 1997; 42: 1474- 1478.
- Sterner RW, Elser JJ. Ecological Stoichiometry: The Biology of Elements from Molecules to the Biosphere. Princenton University Press. 2002.
- Mataloun MM, Leone CR. Human milk mineral intake and serum concentrations of calcium and phosphorus in newborn term infants: influence of intrauterine growth restriction. Acta Paediatr. 2000; 89: 1093–7.
- Khorana M, Jiamsajjamongkhon C. Pilot study on growth parameters and nutritional biochemical markers in very low birth weight preterm infants fed human milk fortified with either human milk fortifier or post discharge formula. J Med Assoc Thail. 2014; 97: S164–S175.
- Dempsher DP. Whole body nitrogen kinetics and their relationship to growth in short children treated with recombinant human growth hormone. Pediatr Res. 1990; 28: 394–400.
- Lettre G. Recent progress in the study of the genetics of height. Hum Genet. 2011; 129: 465–472.
- Deaton A. Height, health, and development. Proc Natl Acad Sci. 2007; 104: 13232–13237.
- Silventoinen K, Kaprio J, Lahelma E, et al. Relative Effect of Genetic and Environmental Factors on Body Height?: Differences Across Birth Cohorts Among Finnish Men and Women. Am J Public Health. 2000; 90: 627–630.
- Haeffner LS, Barbieri MA, Rona RJ, et al. Human Development Programme. Human Development Report 2016 Human Development for Everyone. (2016). The relative strength of weight and length at birth in contrast to social factors as determinants of height at 18 years in Brazil. Ann Hum Biol. 2002; 29: 627–640.
- Green J. Height and cancer incidence in the Million Women Study: prospective cohort, and meta-analysis of prospective studies of height and total cancer risk. Lancet Oncol. 2011; 12: 785–794 .DTU - Technical University of Denmark. Fodevareinstituttet (http://www.food.dtu.dk/english). 21–22 (2016).
- World Cancer Research Fundation / American Institute for Cancer Research. Food, Nutrition, Physical Activity, and the Prevention of Cancer: a Global Perspective. (World Cancer Research Fundation / American Institute for Cancer Research, 2007). at
- Davies NM. The effects of height and BMI on prostate cancer incidence and mortality: a Mendelian randomization study in 20,848 cases and 20,214 controls from the PRACTICAL consortium. Cancer Causes Control. 2015; 26: 1603–1616.
- NCD-RISC. A century of trends in adult human height. Elife. 2016; 5: 1–29.
- Rosenbush SW, Parker JM. Height and heart disease. Reviews in Cardiovascular Medicine. 2014; 15: 102-108.
- Nüesch E, Dale C, Palmer TM, et al. Adult height, coronary heart disease and stroke: a multi-locus Mendelian randomization meta-analysis. International Journal of Epidemiology. 2016; 45: 1927-1937.
- Nelson CP, Hamby SE, Saleheen D, et al. Genetically determined height and coronary artery disease. New England Journal of Medicine. 2015; 372: 1608-1618.
- Tilman D, Clark M. Global diets link environmental sustainability and human health. Nature. 2014; 515: 518–522.
- Obersteiner M, Peñuelas J, Ciais P, et al. The Phosphorus Trilemma. Nat Geosci. 2013; 6: 897–898.
- Cordell D, White S. Peak phosphorus: Clarifying the key issues of a vigorous debate about long-term phosphorus security. Sustainability. 2011; 3: 2027–2049.
- Elser J, Bennett E. A broken biogeochemical cycle. Nature. 2011; 478: 29–31.
- Fisher BA. The correlation between relatives on the supposition of Mendelian inheritance. Trans R Soc Edinbg. 1918; 399–433.
- Food and Agriculture organization of the United Nations. Food and Agriculture Organization of the United Nations. 2014. at http://faostat.fao.org/default.aspx
- INFOODS. FAO/INFOODS Food Composition Database for Biodiversity. (2013).
- Tübingen U. (http://www.uni-tuebingen.de/en/faculties/economics-and-social-sciences/subjects/school-of-business-and-economics/faculty/economics/wirtschaftsgeschichte/data-hub-height.html). 2016; 1–4.
- UNICEF. UNICEF Data?: Monitoring the Situation of Children and Women TOPIC + COUNTRY. Unicef. 2014. at
- USDA-US Department of Agriculture. Foods List (https://ndb.nal.usda.gov/ndb/search/list). 2016; 1–12.